 how-to
How to Automate Property Risk Assessments
Table of Contents
- Why Automate Property Risk Assessments
- Step 1: Identify Property Risks and Data Sources
- Step 2: Collect and Centralize Property Data
- Step 3: Build a Risk Scoring Model
- Using Automated Risk Assessment Tools for Continuous Monitoring
- Drone Inspection for Property Risk Evaluation and Data Accuracy
- Implementing Real Estate Risk Mitigation Strategies
- Step 4: Set Up Alerts and Remediation Tracking
- Frequently Asked Questions
Last Updated: October 20, 2026
Why Automate Property Risk Assessments
Automating property risk assessments saves time and catches problems early. Manual reviews are slow, inconsistent, and easy to miss critical issues.
Automation changes this: collect data once, score it consistently, and track changes over time.
Automated workflows can help cut assessment time by half, catching structural issues before they become expensive repairs and staying compliant.
Step 1: Identify Property Risks and Data Sources
Start by listing all the risks that matter for your properties, a commercial building faces different threats than a residential home.
Cover three areas: physical conditions, environmental factors, and regulatory requirements. Missing any creates blind spots.
Physical and structural risks
Physical risks are problems you can see or measure directly.
Common physical risks include:
- Roof condition and age
- Foundation cracks or settlement
- Structural damage from weather or age
For each property, document current condition, last service dates, and visible damage, your baseline for risk scoring.
Environmental and climate hazards
Environmental risks come from outside the property and depend on location and climate.
These include:
- Flood risk based on proximity to water
- Wildfire risk in high-fire zones
- Severe weather exposure (hail, wind, ice)
Check flood maps, wildfire risk assessments, and historical weather data to understand each property's climate threats, this shapes maintenance priorities and insurance needs.
Compliance and regulatory requirements
Regulatory risks involve building codes, safety standards, and legal requirements. Non-compliance creates liability.
Key areas include:
- Building code compliance for the property age and type
- Accessibility requirements under ADA standards (ADA Standards for Accessible Design)
- Fire safety codes and emergency exits
Document which regulations apply to each property and create a checklist to prevent compliance failures that trigger fines or liability claims.
Step 2: Collect and Centralize Property Data
Data collection is where automation starts, you need reliable information to score each property accurately.
Create a central database where all property data lives. One source of truth makes automation possible.
Collect these data types:
- Property details: address, age, square footage, construction type
- Inspection reports: photos, notes, dates, inspector names
- Maintenance history: what was fixed, when, by whom, cost
Use multiple data sources: inspection reports, municipal records, weather databases, and aerial inspection services like those Phoenix Drone Pros provides for current roof and structural conditions.
Step 3: Build a Risk Scoring Model
Risk scoring turns raw property data into decisions. To automate assessments reliably, define likelihood, impact, weighting, thresholds, and confidence explicitly, then calibrate them against properties you already know.
Start simple, but build the model so it can be audited and adjusted.
Define likelihood and impact separately
Better models score two dimensions independently:
- Likelihood, how probable is the failure or event within a defined horizon (typically 12 months)? Use a 1-5 scale anchored to observable conditions: 1 = no known defect and recent service records; 3 = deferred maintenance or age past expected service life; 5 = active defect, prior failure, or hazard-zone location.
- Impact, if it happens, how bad is it? Score against safety, property damage, business interruption, and compliance exposure. A 1-5 scale works: 1 = cosmetic or routine repair; 3 = system replacement or tenant displacement; 5 = injury risk, structural failure, or regulatory shutdown.
Multiply likelihood by impact to get a 1-25 risk score per item, far more defensible than a single subjective point total.
Weight categories to reflect your portfolio
Not every risk category deserves equal weight, a multifamily portfolio may weight life-safety systems heavily, a warehouse portfolio roof and envelope condition. Assign weights that sum to 100%:
| Category | Example Weight | Rationale |
|---|---|---|
| Life safety and fire systems | 30% | Injury and liability exposure |
| Structural integrity and envelope | 25% | Highest repair cost and business interruption |
| Environmental and climate exposure | 20% | Location-driven and insurance-sensitive |
| Compliance status | 15% | Fines, closures, and legal exposure |
| Maintenance backlog | 10% | Leading indicator of future failures |
Document why each weight was chosen; the rationale is your audit trail at annual review.
Set thresholds that trigger action, not just labels
Thresholds should map to workflow, not just color codes:
- Score 1-6: Monitor. No action beyond scheduled maintenance.
- Score 7-12: Schedule. Create a work order within 90 days.
- Score 13-19: Prioritize. Assign an owner and require a mitigation plan within 30 days.
Tie each threshold to a named role and response time, a threshold without an owner is just a number.
Attach a confidence score to every assessment
Add a confidence rating based on data completeness and recency:
- High confidence: Current inspection (within 12 months), complete service records, verified hazard data.
- Medium confidence: Inspection older than 12 months or missing one data source.
- Low confidence: No recent inspection, missing records, or conflicting data.
Low-confidence scores should route to human review before driving capital decisions, preventing automation bias.
Calibrate against known properties
Before rollout, run the model against 10-20 properties whose conditions you know well. Ask:
- Does the model rank the known-problem properties highest?
- Are any low-scoring properties known to have serious issues? If so, your data inputs or weights are wrong.
- Do two reviewers scoring the same property reach similar results? If not, your anchors are too vague.
Refine the anchors, not the math, until scores match reality. A consistent, explainable model beats a complex one nobody trusts.
Keep the model versioned
Record the model version, weights, and thresholds for every assessment. When you change the model, rescore a sample under both versions to avoid silent drift in your rankings.
Your model need not be perfect, just consistent, documented, and calibrated. That makes automated assessments defensible to owners, insurers, and regulators.
Using Automated Risk Assessment Tools for Continuous Monitoring
Once your model is built, automation software makes it run continuously, but tool selection and integration decide whether monitoring produces reliable signals or just noise.
What continuous monitoring tools should do
A capable platform handles five functions:
- Ingest new data from inspections, sensors, municipal records, and hazard feeds on a defined schedule.
- Validate incoming data for completeness, format, and plausibility before scoring.
- Score properties against your versioned model and flag changes beyond a defined delta.
If a tool cannot show its data lineage, where a score came from and which inputs changed, it will be hard to defend when a decision is questioned.
Connect the right data sources at the right frequency
Match each source to a refresh schedule:
| Data source | Typical refresh | Notes |
|---|---|---|
| Inspection reports and photos | Per inspection cycle (annual or event-driven) | Require structured fields, not just PDFs |
| Aerial and thermal imagery | Quarterly to annual, or after severe weather | Useful for roof and envelope change detection |
| Sensor feeds (leak, temperature, occupancy) | Continuous or near-real-time | High volume; filter for threshold events |
| Municipal permit and code records | Monthly or quarterly | Availability varies by jurisdiction |
| Flood, wildfire, and hazard maps | Annually or when maps are revised | Record the map version used |
| Insurance and claims history | Annually | Align with renewal cycles |
Build integrations with APIs where available and scheduled file imports where not. Document refresh frequency for every source so reviewers know how current a score is.
Handle data quality explicitly
Missing and stale data are the norm. Build rules for both:
- Missing data: Do not default to a low-risk score. Assign a neutral or unknown score and route to review. Record which field was missing.
- Conflicting data: When an inspection and a municipal record disagree, flag the conflict rather than silently choosing one.
- Stale data: Apply an age penalty or confidence downgrade when a source exceeds its refresh window.
A data-completeness score per property, percentage of required fields populated and current, lets reviewers judge how much to trust an automated result.
Keep humans in the loop where it matters
Automation should handle collection, scoring, and routing; humans should own decisions with safety, legal, or capital consequences:
- Fully automated: Data ingestion, score calculation, threshold alerts, routine report generation.
- Human review required: Any critical-tier score, any low-confidence assessment, any override of a model result, and any decision to accept rather than mitigate a known risk.
- Expert approval: Structural, fire-safety, and environmental findings that could affect occupancy or trigger regulatory action.
Document every override with reviewer, reason, and date, override logs detect automation bias and improve the model over time.
Roll out in phases
A phased rollout reduces risk and builds trust:
- Pilot: One property type, 10-20 properties, manual review of every automated score.
- Calibrate: Compare automated scores to reviewer judgment; adjust anchors and weights.
- Expand: Add property types and data sources; reduce manual review to exceptions only.
- Optimize: Automate reporting, tune alert thresholds, and integrate remediation tracking with work-order systems.
Build-versus-buy depends on portfolio size and integration complexity: small portfolios often get faster value from a configurable platform, while large portfolios with unusual data sources may need custom integration.
Measure whether automation is working
Define KPIs before rollout to prove value:
- Assessment cycle time, days from data receipt to completed score.
- Data completeness, percentage of required fields current per property.
- Overdue actions, count and age of remediation tasks past deadline.
Review these monthly, they turn continuous monitoring from a software feature into a managed process.
Drone Inspection for Property Risk Evaluation and Data Accuracy
Aerial inspection technology has transformed how teams assess property conditions, capturing detailed data that ground-level inspections miss.
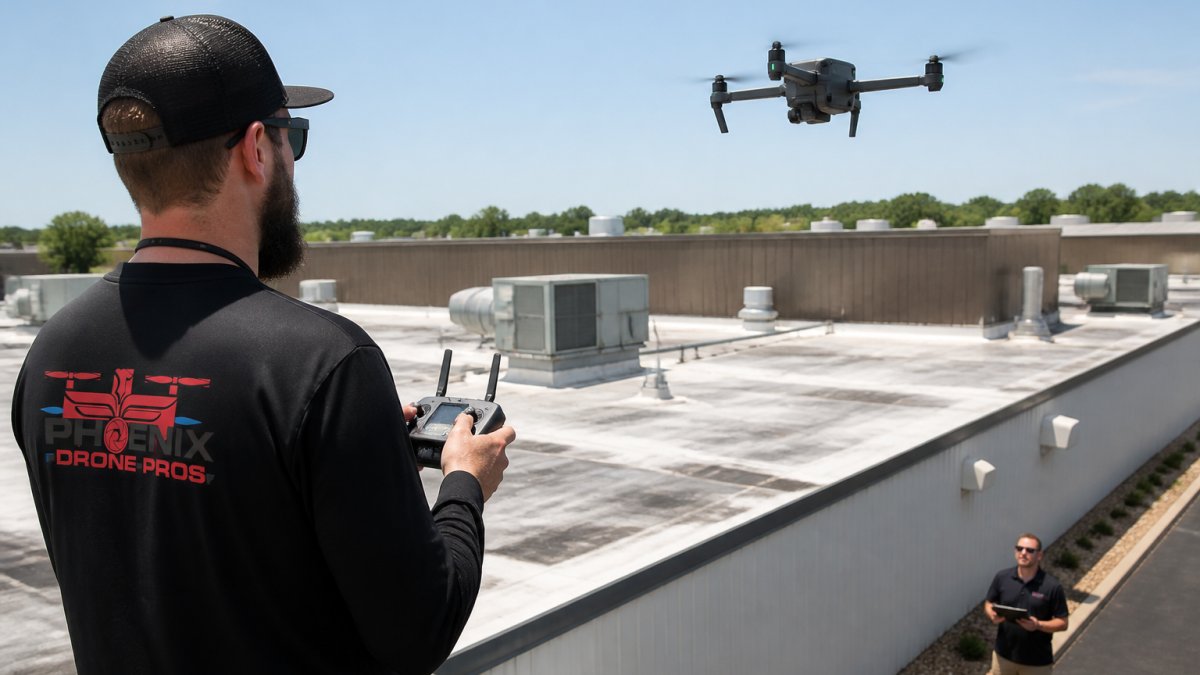
Here's what drone inspection adds to your risk assessment:
- High-resolution roof photography showing condition, damage, and wear
- Thermal imaging to detect moisture, insulation problems, and heat loss
- 3D mapping of property layout and structures
Integrating drone data into your automated system makes risk scores more accurate, basing decisions on current visual evidence rather than old reports or guesses.
Drone inspection pays back quickly: you catch problems early, avoid expensive failures, and gain documented evidence for insurance and compliance.
Implementing Real Estate Risk Mitigation Strategies
Identifying risks is only half the work, you need a plan to reduce them.
Risk mitigation means taking action to lower the score.
Common mitigation actions:
- Repair or replace failing systems (roof, HVAC, electrical)
- Upgrade safety features (fire suppression, emergency exits)
- Improve drainage or waterproofing to reduce flood risk
For each high-risk property, create a mitigation plan. Assign responsibility. Set deadlines. Track progress.
Document everything, before-and-after photos, contractor reports, permits, and certifications, as part of your property record supporting your risk assessment.
Step 4: Set Up Alerts and Remediation Tracking
Automation only works if you act on the information.
Alerts trigger when:
- A property score crosses a risk threshold
- New inspection data shows significant change
- A compliance deadline approaches
Remediation tracking documents what happens next. When an alert fires:
- Someone reviews the issue
- A decision is made (repair, monitor, accept risk, transfer risk)
- An action is assigned with a deadline
- Progress is tracked as work happens
- Completion is verified with updated data
- The property is rescored
Keep a record of every action, an audit trail showing due diligence and documenting your risk management process.
The goal is a continuous cycle, assess, identify risks, plan mitigation, execute, verify, reassess, and automation keeps it running smoothly.
Phoenix Drone Pros helps teams at every stage. Our FAA-certified pilots capture thermal imaging, roof condition, structural details, and site documentation that feed your assessment system, making risk scores more accurate and current.
Frequently Asked Questions
How does automation improve the accuracy of property risk assessments?
Automation removes manual data entry errors, applies consistent scoring logic across all properties, and integrates multiple data sources simultaneously. By centralizing inspection records, external hazard data, and compliance requirements in one system, you reduce assessment gaps and ensure no risk factors are overlooked. Continuous monitoring flags changes in real time rather than waiting for periodic reviews, catching emerging risks before they escalate.
What data points are essential for automated property risk modeling?
Core data includes property age and construction type, roof condition and materials, location and climate exposure, maintenance history, compliance violations, and insurance claims. External data sources add value: flood maps, seismic zones, crime statistics, and permit records. Inspection imagery, especially thermal or aerial drone footage, provides visual evidence of structural condition. The more complete your data set, the more accurate your risk scoring and the faster your automation workflow runs.
How do drone inspections integrate with automated risk assessment software?
Drone inspections capture high-resolution imagery and thermal data that feed directly into your risk assessment system. Automated workflows extract inspection dates, identified defects, repair recommendations, and priority areas, then update your property risk register without manual data re-entry. This integration accelerates due diligence cycles, ensures inspection findings are documented consistently, and triggers alerts when critical issues require immediate remediation or renewal decisions.
Can I create my own risk assessment without buying software?
Yes, you can build a spreadsheet-based risk assessment with manual scoring and checklists. However, scaling to multiple properties, managing continuous updates, and integrating external data sources quickly becomes time-consuming. Automation software handles these tasks at scale, reduces human error, and provides audit trails for compliance. For a small portfolio, manual assessment may work; for active portfolios or regulatory requirements, automation saves hours and improves consistency.