 comparison
Cost Benefit Analysis of Property Inspection Tools
Table of Contents
- Why Property Inspection Tools Matter for Your Bottom Line
- Property Inspection App Cost: What You'll Actually Pay
- Manual vs. Digital Property Inspections: A Side-by-Side Comparison
- Property Inspection App ROI: Quantifying the Payback
- Property Inspection Checklist App: Features That Drive Value
- Tools Beyond Apps: Drone Inspections and Their Cost-Benefit
- How to Choose the Right Property Inspection Tools for Your Needs
- Conclusion: Making a Data-Driven Decision
- Frequently Asked Questions
Last Updated: October 12, 2026
Why Property Inspection Tools Matter for Your Bottom Line
Property inspection tools are software and hardware systems that help owners, managers, and inspectors document a building's condition, flag defects early, and turn findings into maintenance decisions. At Phoenix Drone Pros, we work with property managers, agents, and construction teams weekly, and the pattern is consistent: teams that inspect on a fixed schedule spend less on emergency repairs than teams that wait for something to break.
A small leak found during a routine inspection is a patch; the same leak found after it saturates drywall, insulation, and framing is a remediation project. Early detection is where the money is.
The core argument: the tool is never the return on investment. The inspection frequency and the speed of follow-up are. A cheap app used monthly beats an expensive platform that sits unused.
Property Inspection App Cost: What You'll Actually Pay
Property inspection app cost falls into two models: flat subscriptions and per-report fees. Most home inspection platforms use subscriptions; some general-purpose tools charge per report.
Published pricing gives a useful benchmark. Spectora starts at $109 per month, with annual pricing at $1,090 and additional inspectors at $99 per month. Home Inspector Pro starts at $74 per month. SwiftReporter offers a flat-rate plan at $99 per month. SafetyCulture offers a free plan, the easiest way to test whether digital checklists fit your workflow before committing.
For context on the wider market, SwiftReporter's 2026 home inspection software comparison notes that typical software in this category runs $50 to $150 per month.
| Tool | Starting Price | Model | Free Tier | Best For |
|---|---|---|---|---|
| Spectora | $109/month | Subscription | No | All-in-one inspection businesses |
| SwiftReporter | $99/month | Flat-rate subscription | No | Predictable monthly cost |
| Home Inspector Pro | $74/month | Subscription | No | Budget-conscious home inspectors |
| SafetyCulture | Free | Free plan | Yes | Testing fit before committing |
Subscription and Per-Report Pricing Models
Subscriptions suit teams that inspect regularly: a fixed monthly fee covers as many inspections as your schedule allows. Per-report pricing suits occasional users, but cost per inspection rises fast as volume grows. The break-even question is straightforward: at $15 per report, 7 inspections per month equals the $99 subscription, above that, the subscription wins.
The Full Total Cost of Ownership Model
Sticker price is only the first line of a total-cost-of-ownership (TCO) calculation:
- Subscription or license fees: The advertised monthly or annual price.
- Setup and implementation: One-time configuration, template building, and account provisioning (4-16 staff hours).
- Training: 2-8 hours per user in year one, plus refreshers after major updates.
Three-year TCO formula:
TCO = (Annual subscription × 3) + Setup + Training + Migration + Integrations + Hardware + (Staff hours × loaded hourly rate)
Worked TCO Example: Small Inspection Firm
A two-inspector firm adopting a $99/month platform:
| Cost Category | Year 1 | Year 2 | Year 3 |
|---|---|---|---|
| Subscription ($99/mo) | $1,188 | $1,188 | $1,188 |
| Setup and templates | $600 | $0 | $0 |
| Training (2 users × 6 hrs × $35/hr) | $420 | $0 | $0 |
| Data migration | $300 | $0 | $0 |
| Hardware (2 tablets, cases) | $900 | $0 | $300 |
| Staff time (2 hrs/mo × $35/hr) | $840 | $840 | $840 |
| Total | $4,248 | $2,028 | $2,328 |
Three-year TCO: $8,604. The advertised subscription total is $3,564, less than half the real cost. Comparing only the subscription line leads to bad decisions.
Hidden Costs: Training, Implementation, and Data Migration
Budget for three extras beyond sticker price: training time (productivity dips during the first few inspections), data migration (moving historical reports and client records takes time, and some platforms charge), and template building (your first custom checklist takes longer than expected).
Manual vs. Digital Property Inspections: A Side-by-Side Comparison
Manual inspections use paper checklists, clipboards, and phone photos. Digital inspections use an app with structured checklists, photo capture, and automated reports. The difference shows up in time, consistency, and how quickly findings reach decision-makers.
Time and Labor Differences
Digital workflows save time in three places: no retyping notes, no chasing photos, and no rebuilding the report from scratch. An inspector can often generate the client-ready report on site rather than at a desk hours later. Standardization matters just as much: a digital checklist forces every inspector to capture the same items, reducing missed defects and making reports comparable across properties and over time.
Property Inspection App ROI: Quantifying the Payback
Property inspection app ROI is the point where cumulative savings from avoided repairs and saved labor exceed the total cost of the software. For most small teams, that arrives within the first year. Two savings streams drive it: early detection (catching a roof or plumbing issue before it spreads) and labor (cutting report-writing time per inspection). The second is easier to measure, so start there.
The ROI Formula
ROI = (Labor savings + Avoided repair costs + Risk reduction value) − Total cost of ownership
Payback period (months) = Total cost of ownership ÷ Monthly savings
Break-even inspections per month = Total cost of ownership ÷ (Savings per inspection × 12)
Worked Example: Break-Even for a Mid-Size Property Manager
Picture a manager overseeing 40 rental units with two staff members doing inspections, adopting a $99-per-month platform ($1,188 per year). With setup, training, and hardware in year one, total year-one cost of ownership is roughly $4,248 (see the TCO table above). Assume the digital checklist saves each inspector two hours per week on report writing. At a loaded labor rate of $35 per hour:
- 2 inspectors × 2 hours/week × 52 weeks = 208 hours/year
- 208 hours × $35/hour = $7,280 in annual labor savings
Labor savings alone exceed the $4,248 year-one cost. Payback period: $4,248 ÷ ($7,280 ÷ 12) ≈ 7 months. Add one avoided emergency repair, a slow leak caught at inspection that would have cost $2,500 in remediation three months later, and year-one net benefit rises to roughly $5,532. Break-even inspections per month: $4,248 ÷ ($7,280 ÷ 12 ÷ 40 units) ≈ 28, well within a 40-unit portfolio's routine schedule.
Scenario Table: ROI by Portfolio Size
The math scales. Payback by portfolio size, holding labor rate at $35/hour and assuming 2 hours saved per inspector per week:
| Portfolio Size | Inspectors | Annual Labor Savings | Year-1 TCO | Payback Period |
|---|---|---|---|---|
| 10 units | 1 | $3,640 | $3,500 | ~11.5 months |
| 40 units | 2 | $7,280 | $4,248 | ~7 months |
| 100 units | 3 | $10,920 | $5,000 | ~5.5 months |
| 250 units | 5 | $18,200 | $6,500 | ~4.3 months |
Larger portfolios amortize setup and training across more inspections, so payback accelerates. Small portfolios still break even inside a year if the tool is actually used.
The Avoided-Repair Multiplier
Labor savings are the floor, not the ceiling. Early detection changes a repair's cost curve:
- A roof leak caught at inspection: $300-$800 patch.
- The same leak after drywall and insulation saturation: $2,500-$6,000 remediation.
- A plumbing drip caught early: $150-$400.
One avoided mid-tier repair per year often doubles the software's ROI. That is why inspection frequency matters more than feature count: a monthly walkthrough catches issues while they are still cheap.
What Kills ROI
Three patterns reliably destroy payback:
- Low utilization. A platform used twice a quarter cannot generate labor savings. Unused software has 100% cost and 0% return.
- No follow-up workflow. Detecting an issue but not dispatching a repair erases the avoided-repair benefit.
- Overbuying features. Paying for enterprise modules a small team never opens raises TCO without raising savings.
Property Inspection Checklist App: Features That Drive Value
A property inspection checklist app earns its cost through four features: customizable digital checklists, offline photo capture, automated report generation, and centralized document management. Features outside that list rarely move the payback needle, a platform with 200 features you never open costs the same as one with 20 you use daily.
When evaluating, score each platform against your actual inspection types:
- Does the checklist template match your property type?
- Can inspectors capture photos offline in basements or crawl spaces?
- Does the report generate automatically, or does someone retype it?
That last item matters more than most buyers realize. Data ownership and portability protect you from lock-in.
Tools Beyond Apps: Drone Inspections and Their Cost-Benefit
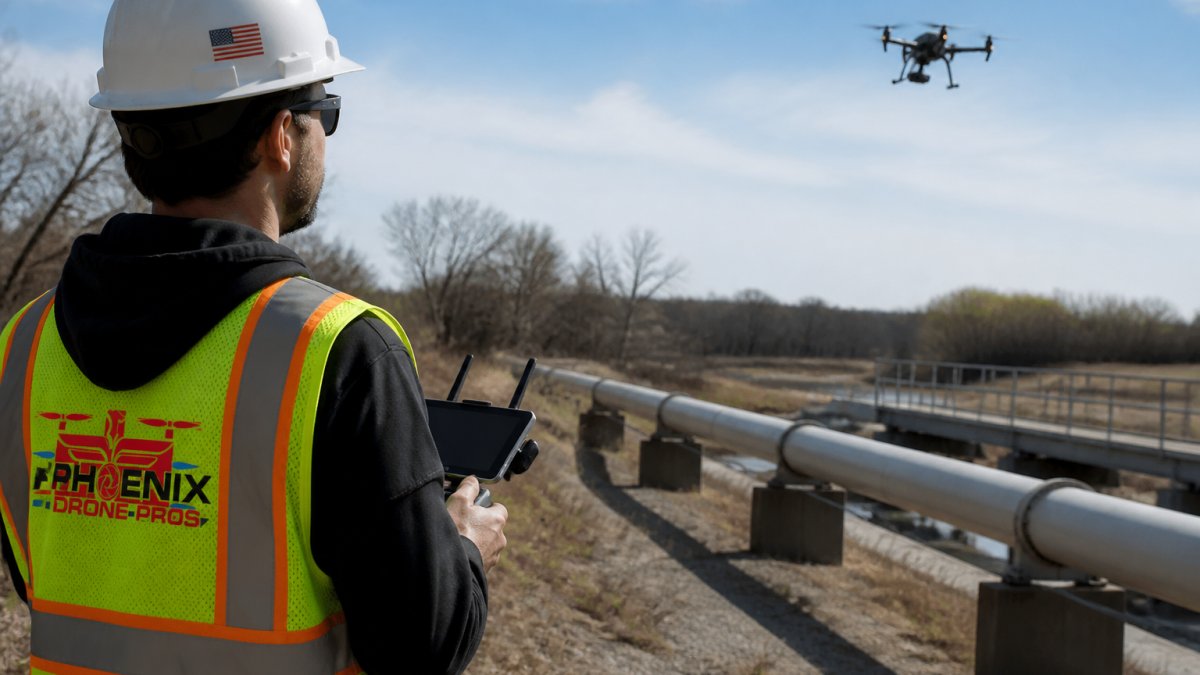
Drone inspections cover what a checklist app cannot: roofs, gutters, chimneys, and elevated structures that are unsafe or slow to reach on foot.
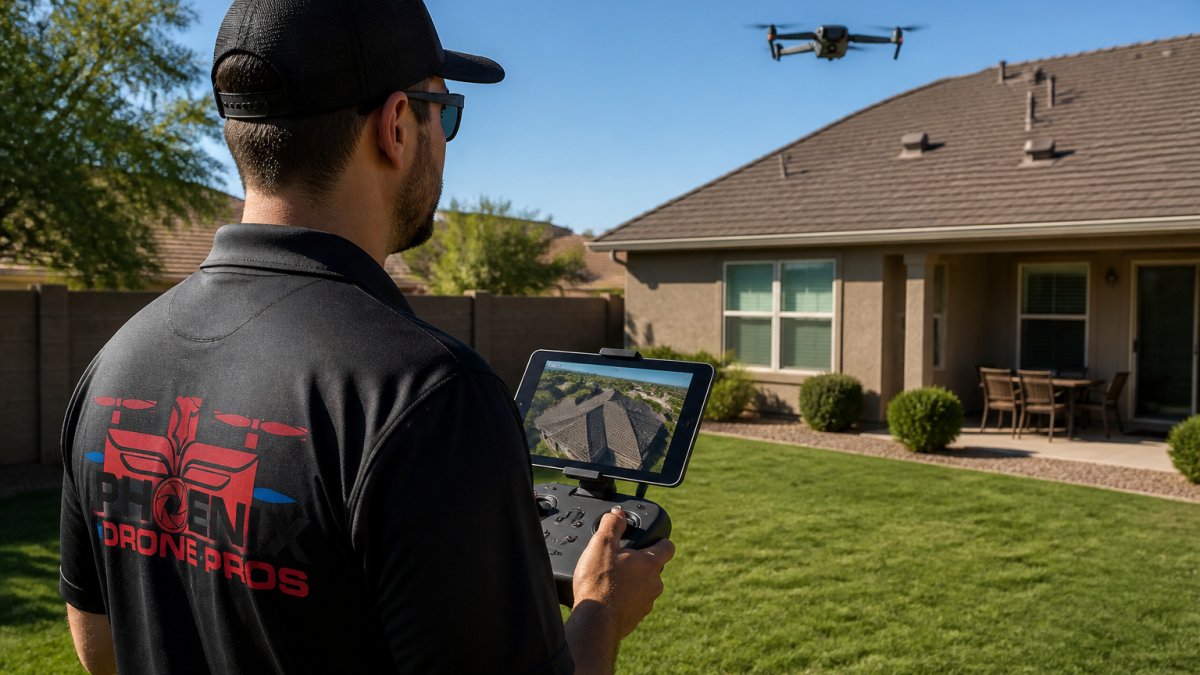
The cost-benefit case rests on safety and access: sending a person onto a steep roof carries real risk, while a drone flight does not, and aerial imaging captures the whole roof in one pass.
This is where Phoenix Drone Pros fits. Our FAA-certified, fully insured pilots have 10+ years of commercial drone experience, and we handle thermal roof inspections and construction progress documentation for property managers, agents, and developers. If you want to see how aerial inspection complements your checklist app, you can schedule a flight and get pricing.
For solar arrays, we also offer drone solar panel cleaning, which pairs naturally with an annual aerial inspection.
How to Choose the Right Property Inspection Tools for Your Needs
Choosing the right property inspection tools starts with matching the tool to your inspection volume, property types, and team size, not with chasing the longest feature list. Work through this sequence:
- Count your monthly inspections. Low volume favors per-report or free tiers; high volume favors subscriptions.
- List your property types. Standard homes fit most apps; steep roofs and commercial sites need aerial coverage.
- Estimate report-writing time today. This is your baseline savings number.
- Test one free tier for a week. SafetyCulture's free plan is a low-risk starting point.
- Add aerial inspection where access is the bottleneck. Apps document; drones reach.
- Check data export before you commit. Portability is your exit strategy.
Conclusion: Making a Data-Driven Decision
The challenge with any cost-benefit analysis is that the savings are projected while the subscription is real. That asymmetry stops a lot of teams from acting. Phoenix Drone Pros brings FAA certification, full insurance, and over a decade of commercial experience to every flight, with local pilots available in Phoenix and San Antonio. Schedule your inspection and get a clear picture of your property from above.
Frequently Asked Questions
How much does property inspection software cost?
Costs vary widely. Home Inspector Pro starts at $74 per month, SwiftReporter at $99 per month, and Spectora at $109 per month. SafetyCulture offers a free plan. Most home inspection software falls in the $50 to $150 monthly range. Annual plans can save money; Spectora's annual price is $1,090, saving $218 versus monthly payments. Additional inspectors may cost extra, such as $99 per month with Spectora. Always check current pricing directly with vendors.
Are property inspection apps worth the investment?
For many property managers and inspectors, yes. Apps reduce manual data entry, standardize checklists, and automate report generation. These features cut labor costs and speed up turnaround. For example, a team doing 50 inspections per month might save several hours per inspection, which adds up. However, the return depends on your volume and current process. If you do very few inspections, a free or low-cost tool may suffice. Evaluate based on your specific workflow.
How do property inspection tools save time and money?
They save time by replacing paper checklists with digital forms that auto-populate reports, attach photos, and sync across devices. This reduces report writing from hours to minutes. Money is saved through early detection of issues like roof leaks or structural damage, preventing costly emergency repairs. Digital tools also improve standardization, reducing errors and liability. For property managers, faster inspections mean less downtime and happier tenants.
What features should I compare in property inspection software?
Focus on reporting speed, customization, offline capability, photo annotation, integration with other systems (like CRM or accounting), and pricing model. Also check if it supports your specific inspection types (e.g., home, commercial, roof). Consider scalability: can you add inspectors without huge cost jumps? Data security and export options matter too. A free trial or demo can help you assess usability before committing.
What hidden costs should I consider when choosing an inspection tool?
Beyond subscription fees, watch for per-report charges, additional user fees, training time, and data migration from old systems. Some tools charge for extra storage or integrations. Implementation can take weeks, affecting productivity. Also, if the tool lacks offline mode, you may need to upgrade devices or data plans. Always ask vendors for a total cost of ownership breakdown, including any add-ons or support fees.